Financial Account Highlights
Status of Consolidated Accounts
※スクロールで表示できます。
| Subject | 2022/3 | 2023/3 | 2024/3 | 2025/3 | 2026/3 | ||
|---|---|---|---|---|---|---|---|
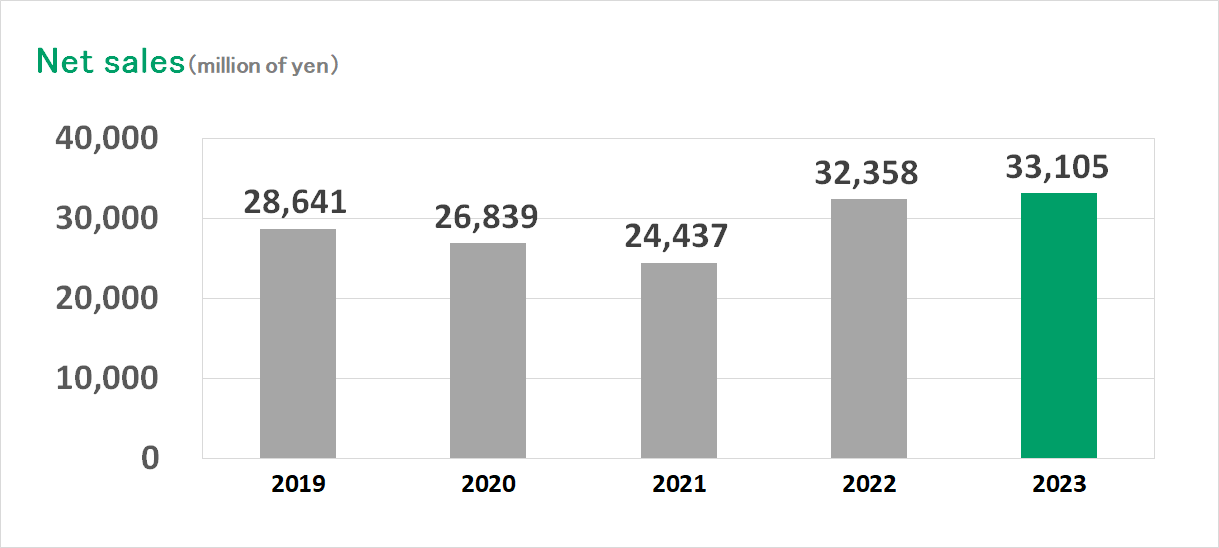
| Net Sales (million of yen) |
32,358 | 33,105 | 32,863 | 32,703 | 32,105 | ||
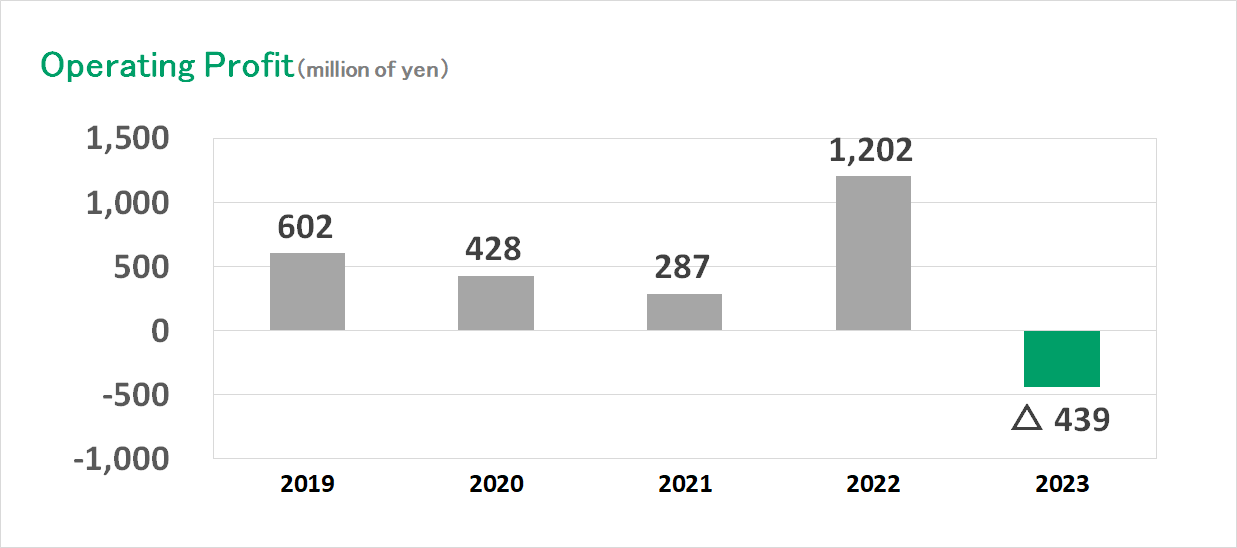
| Operating Profit or Loss (△) (million of yen) |
1,202 | △439 | 361 | 829 | 576 | ||
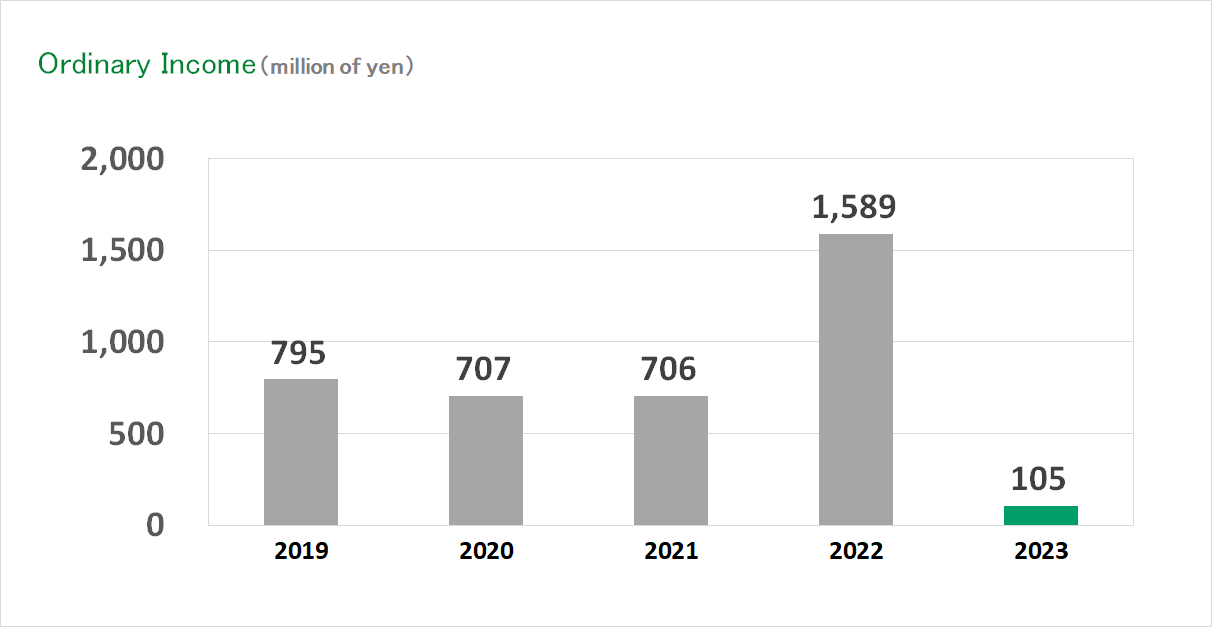
| Ordinary Income (million of yen) |
1,589 | 105 | 780 | 1,195 | 547 | ||
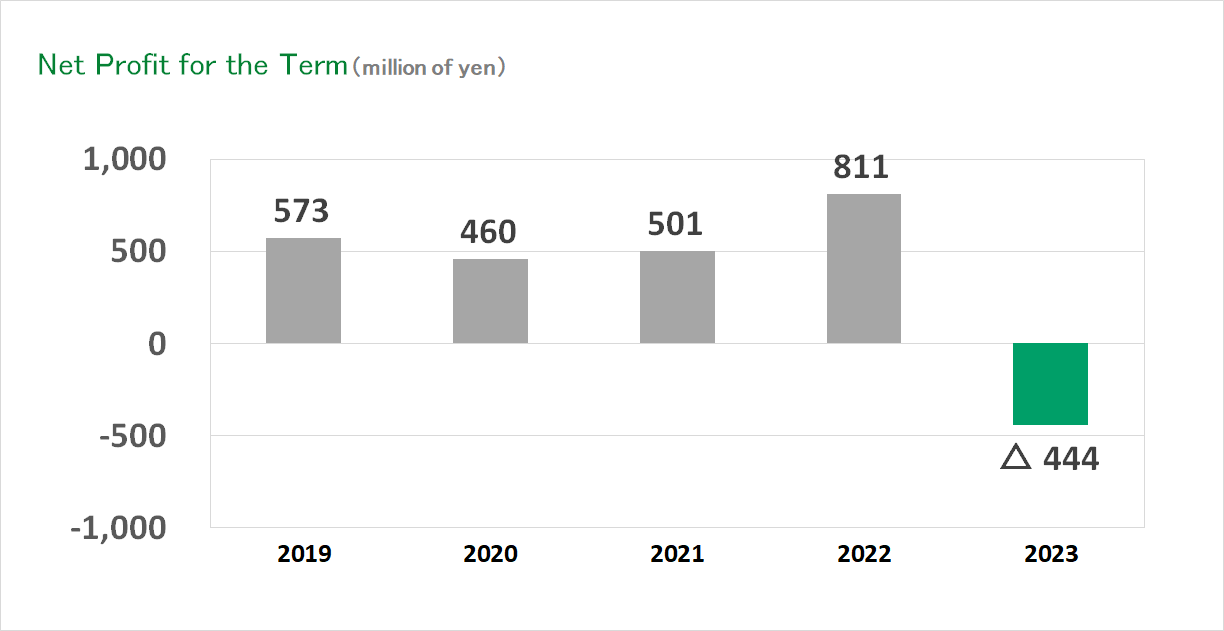
| Net Profit for the Term or Loss (△) (million of yen) |
811 | △444 | 220 | 522 | 597 | ||
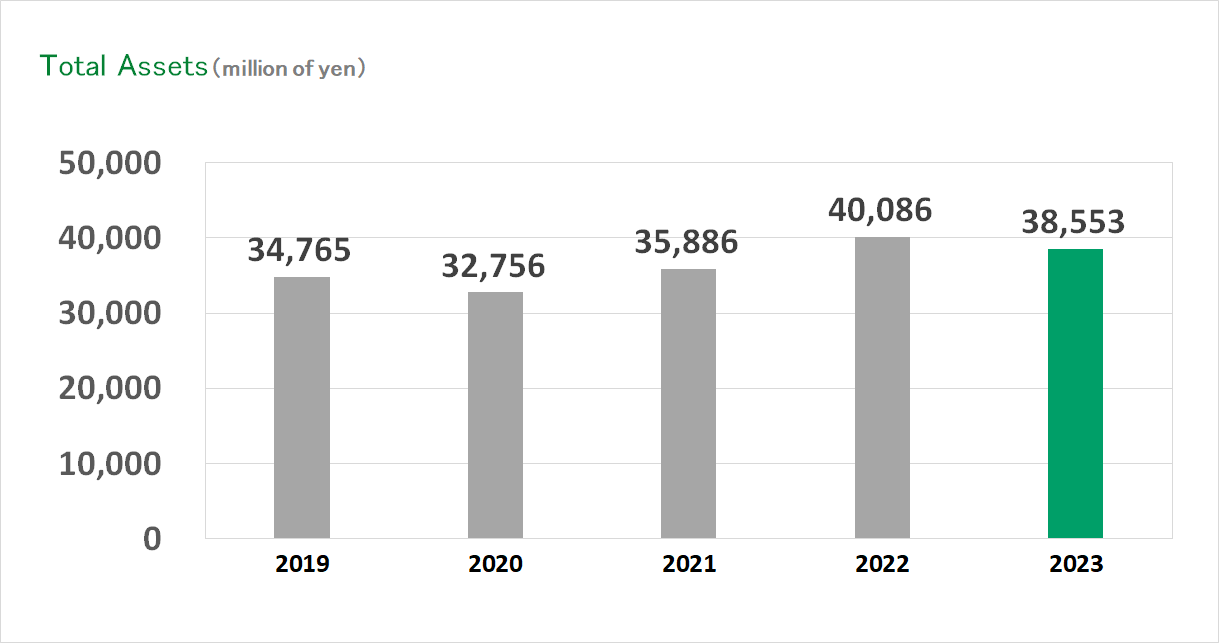
| Total Assets (million of yen) |
40,086 | 38,553 | 40,114 | 37,519 | 40,345 | ||
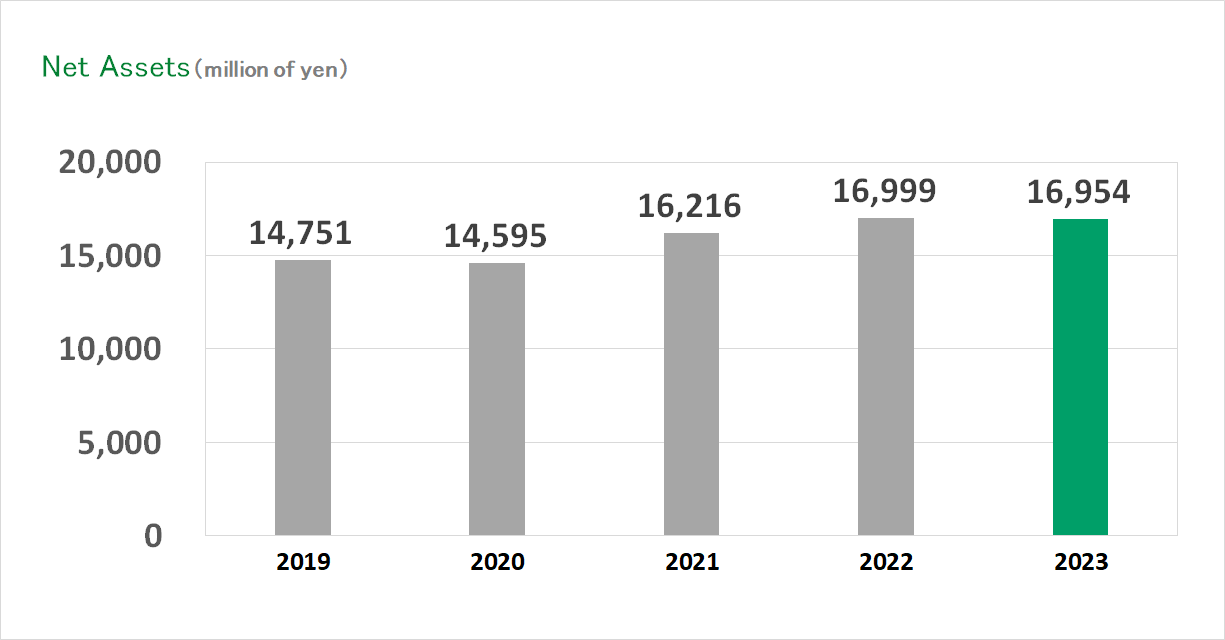
| Net Assets (million of yen) |
16,999 | 16,954 | 18,476 | 18,995 | 20,987 | ||
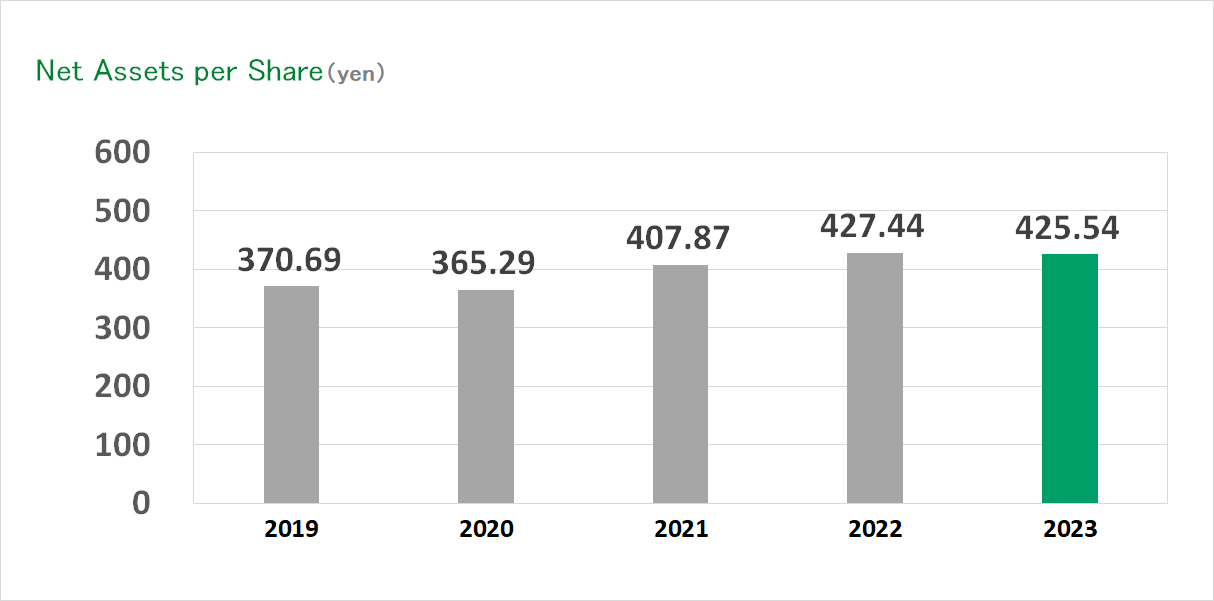
| Net Assets per Share (yen) |
427.44 | 425.54 | 463.60 | 477.02 | 529.55 | ||
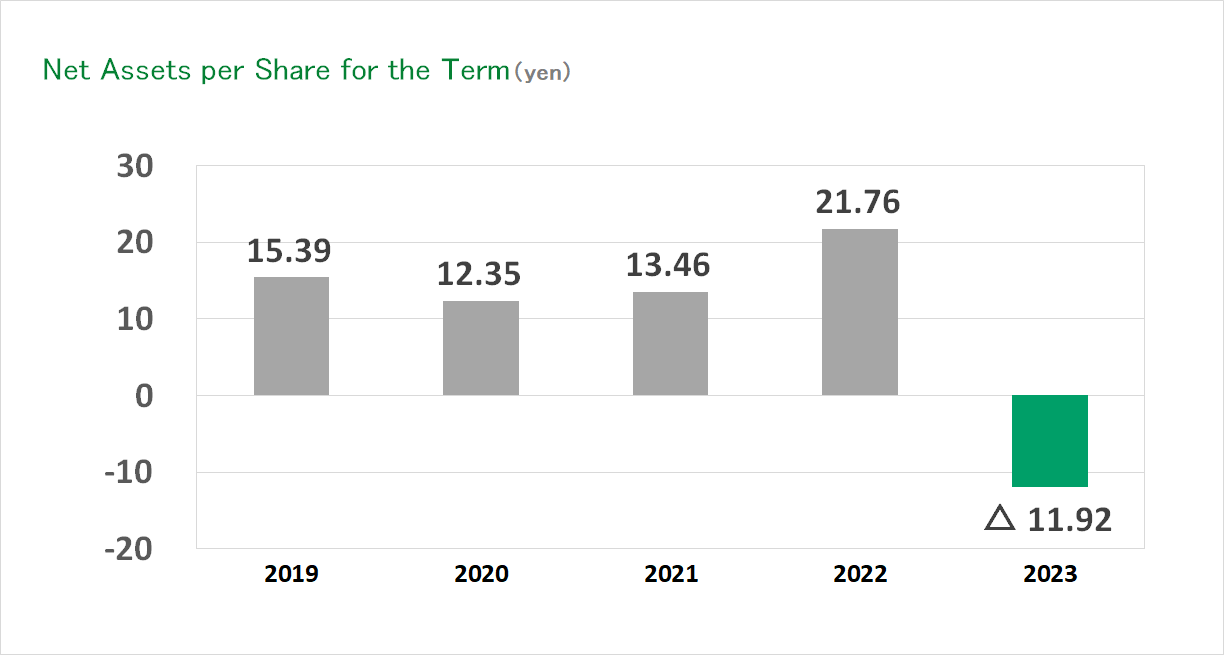
| Net Profit or Loss (△) per Share (yen) |
21.76 | △11.92 | 5.92 | 14.00 | 16.03 | ||
Investor Relations
-

To Shareholders and Investors
-

Financial Account Highlights
-

Individual Investors
-

Corporate Governance
-

General Stock Information
